A data-driven study of 5,160 cross-country flights across four European sites, classified by Spatial Synoptic Classification (SSC v3.0)
AI disclosure: This article was co-authored with Claude (Anthropic). I defined the research question and guided the analysis; Claude wrote the code, ran the statistics, generated the charts, and drafted the text.
If you’ve ever flipped through old aviation meteorology books — the kind with yellowed pages and hand-drawn synoptic charts — you’ll recall that air mass classification used to be a big deal. Classic texts like Wallington’s “Meteorology for Glider Pilots” or Soviet-era synoptic meteorology manuals described in detail how different air masses shape soaring conditions. The intuition was appealing: a cold, dry post-frontal airmass should produce sharp, powerful thermals, while warm humid air dampens convection and caps the boundary layer. Somewhere along the way, as numerical weather prediction took over, this kind of synoptic thinking fell out of fashion. Modern XC pilots check BLH, CAPE, and wind forecasts from Open-Meteo — not air mass type.
I was curious whether the old-school approach still has something to teach us, so I asked Claude to test it against real flight data: 5,160 XC paragliding flights from four geographically diverse European sites, matched against modern SSC v3.0 airmass classifications. The results turned out to be both validating and surprising.
Method
Flight data: XContest archives for four sites spanning 2007–2025:
| Site | Country | Flights | Unique flying dates | SSC station |
|---|---|---|---|---|
| Rapla/Kuusiku | Estonia | 438 | 114 | Tallinn (TLL) |
| Ager | Catalonia, Spain | 1,000 | 296 | Barcelona (BCN) |
| Algodonales | Andalusia, Spain | 1,550 | 507 | Sevilla (SVQ) |
| Bassano del Grappa | Veneto, Italy | 2,172 | 502 | Venice (VCE) + Verona (VRN) |
Airmass classification: SSC v3.0 (Sheridan, Kent State University) assigns each station-day to one of six main types based on synoptic observations:
- DP — Dry Polar: cold, dry, post-frontal clearing
- DM — Dry Moderate: settled continental, moderate temperature and humidity
- DT — Dry Tropical: hot, dry, continental heat
- MM — Moist Moderate: moderate temperature, higher humidity
- MT — Moist Tropical: warm, humid
- TR — Transitional: frontal passage day
(MP — Moist Polar is excluded from most comparisons as it almost never produces XC flights.)
For each flying date we take the best flight distance as the metric of interest: the longest XC recorded that day.
Key Finding: Dry Polar Days Produce the Longest Flights
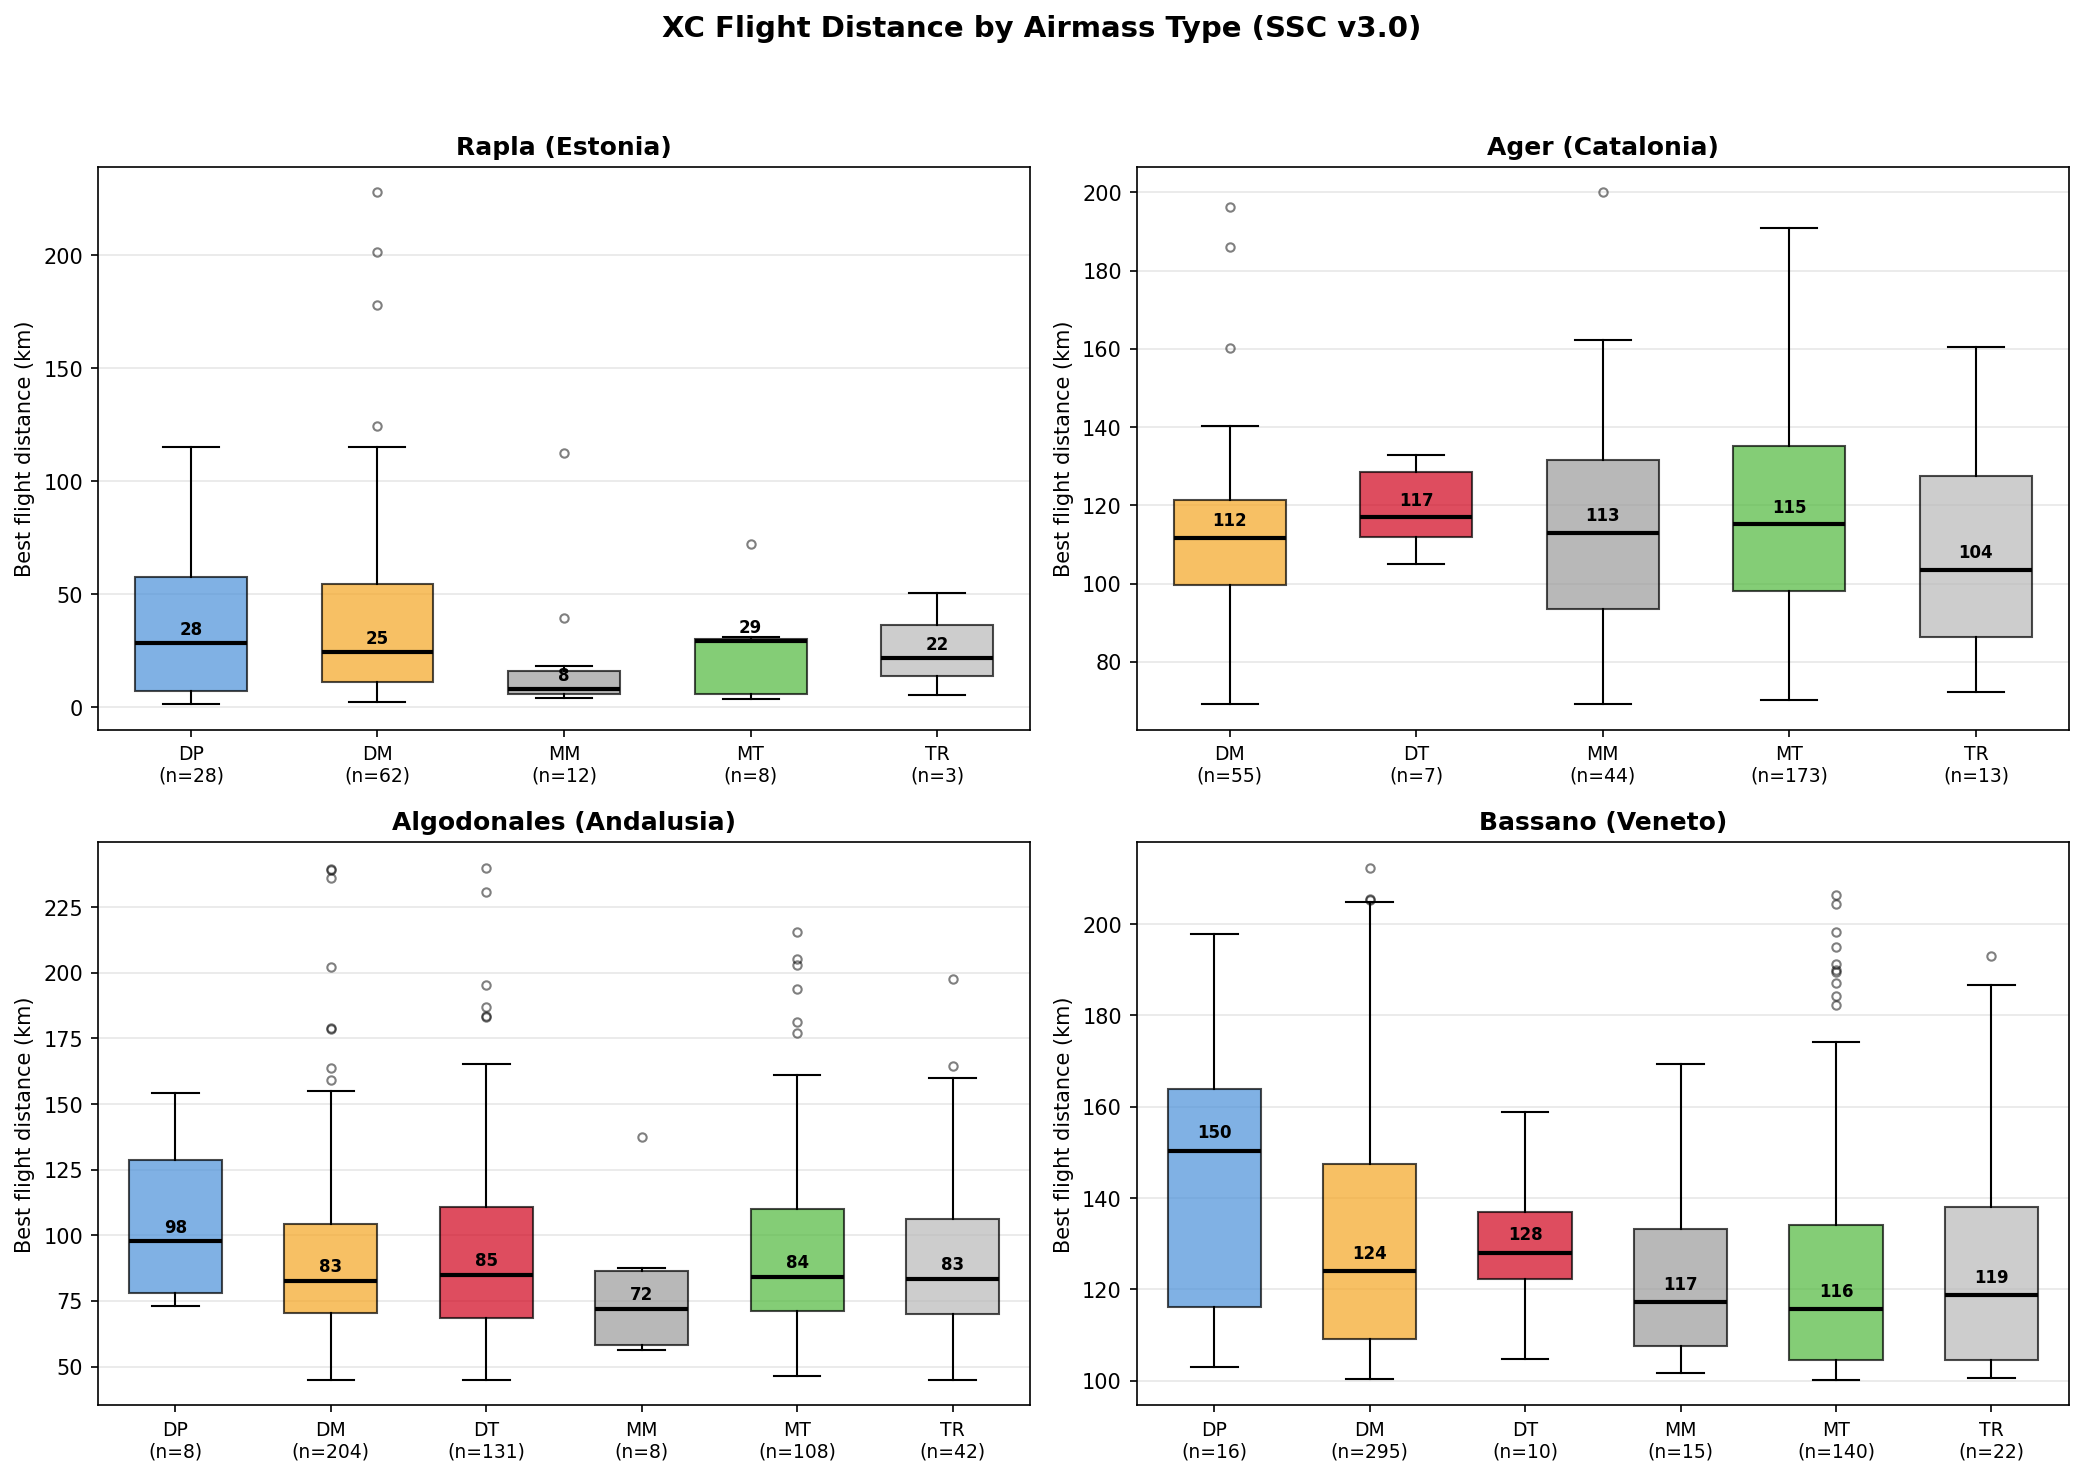
The box plots tell a clear story. DP (Dry Polar) — the classic post-cold-front airmass — ranks #1 for median XC distance at Bassano (150 km) and Algodonales (98 km), and #2 at Rapla (28 km). Across three sites with sufficient data, DP averages rank 1.3 — it is the most consistently high-performing airmass type.
| Airmass | Bassano median | Algodonales median | Rapla median | Avg rank |
|---|---|---|---|---|
| DP | 150 km | 98 km | 28 km | 1.3 |
| DT | 128 km | 85 km | — | 2.0 |
| DM | 124 km | 83 km | 25 km | 3.5 |
| MM | 117 km | 72 km | 8 km | 4.7 |
| MT | 116 km | 84 km | 29 km | 3.3 |
| TR | 119 km | 83 km | 22 km | 4.0 |
The gap is largest at Bassano: DP days average 150 km vs. 124 km for DM — a 21% improvement. At Algodonales, DP leads by 18% over the next best type.
The old-school intuition holds up: post-cold-front air consistently produces the best XC conditions.
But DM Days Are When Most Flying Happens
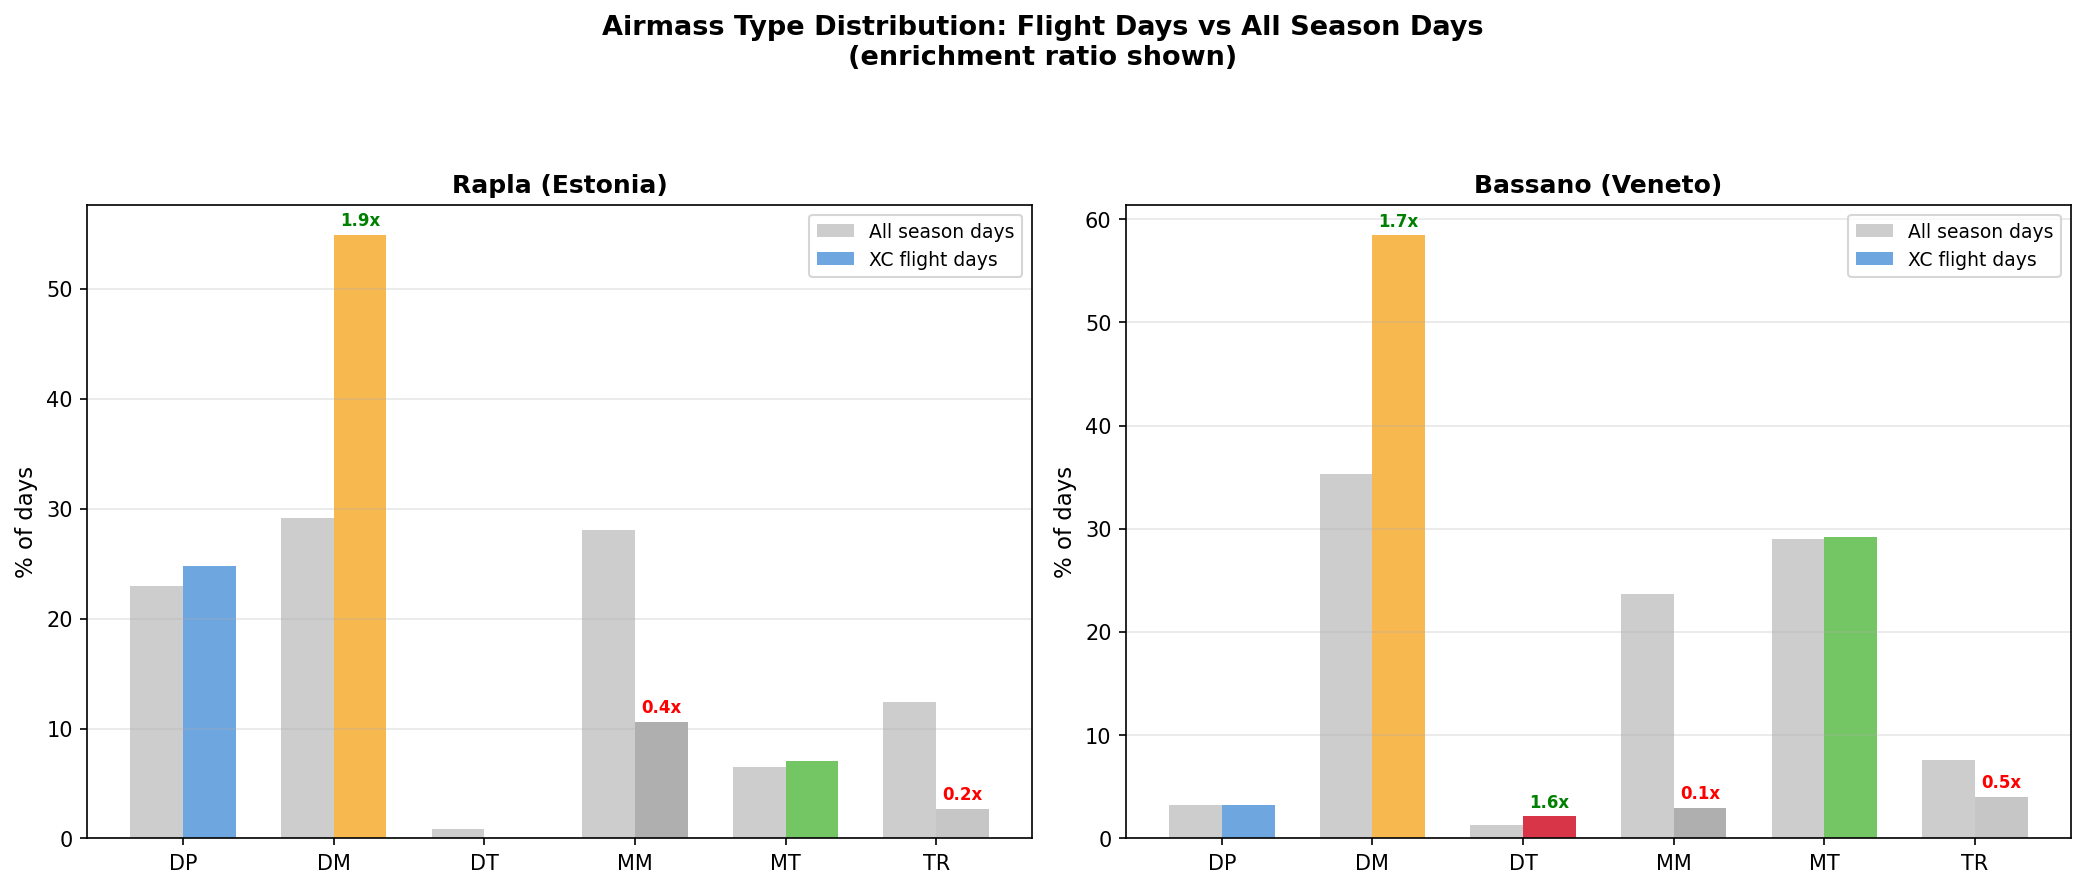
There’s a twist. While DP produces the best individual days, DM (Dry Moderate) is where the volume is. At Rapla, DM accounts for 55% of all XC flight days — almost double its 29% share of season days (1.9x enrichment). At Bassano, DM makes up 60% of flight days (1.7x enrichment).
This makes intuitive sense: DM represents settled high-pressure weather with moderate instability and light winds. It may not produce the most violent thermals, but it creates the broadest window of flyable conditions. More pilots launch, more flights happen, and while individual records are rarer, the cumulative contribution is enormous.
The top-4 longest Rapla flights ever (228, 201, 178, 124 km) were all DM days — because DM combines adequate instability with the light winds that Estonian flatland XC demands.
Flying Day Probability: What Gets You in the Air?
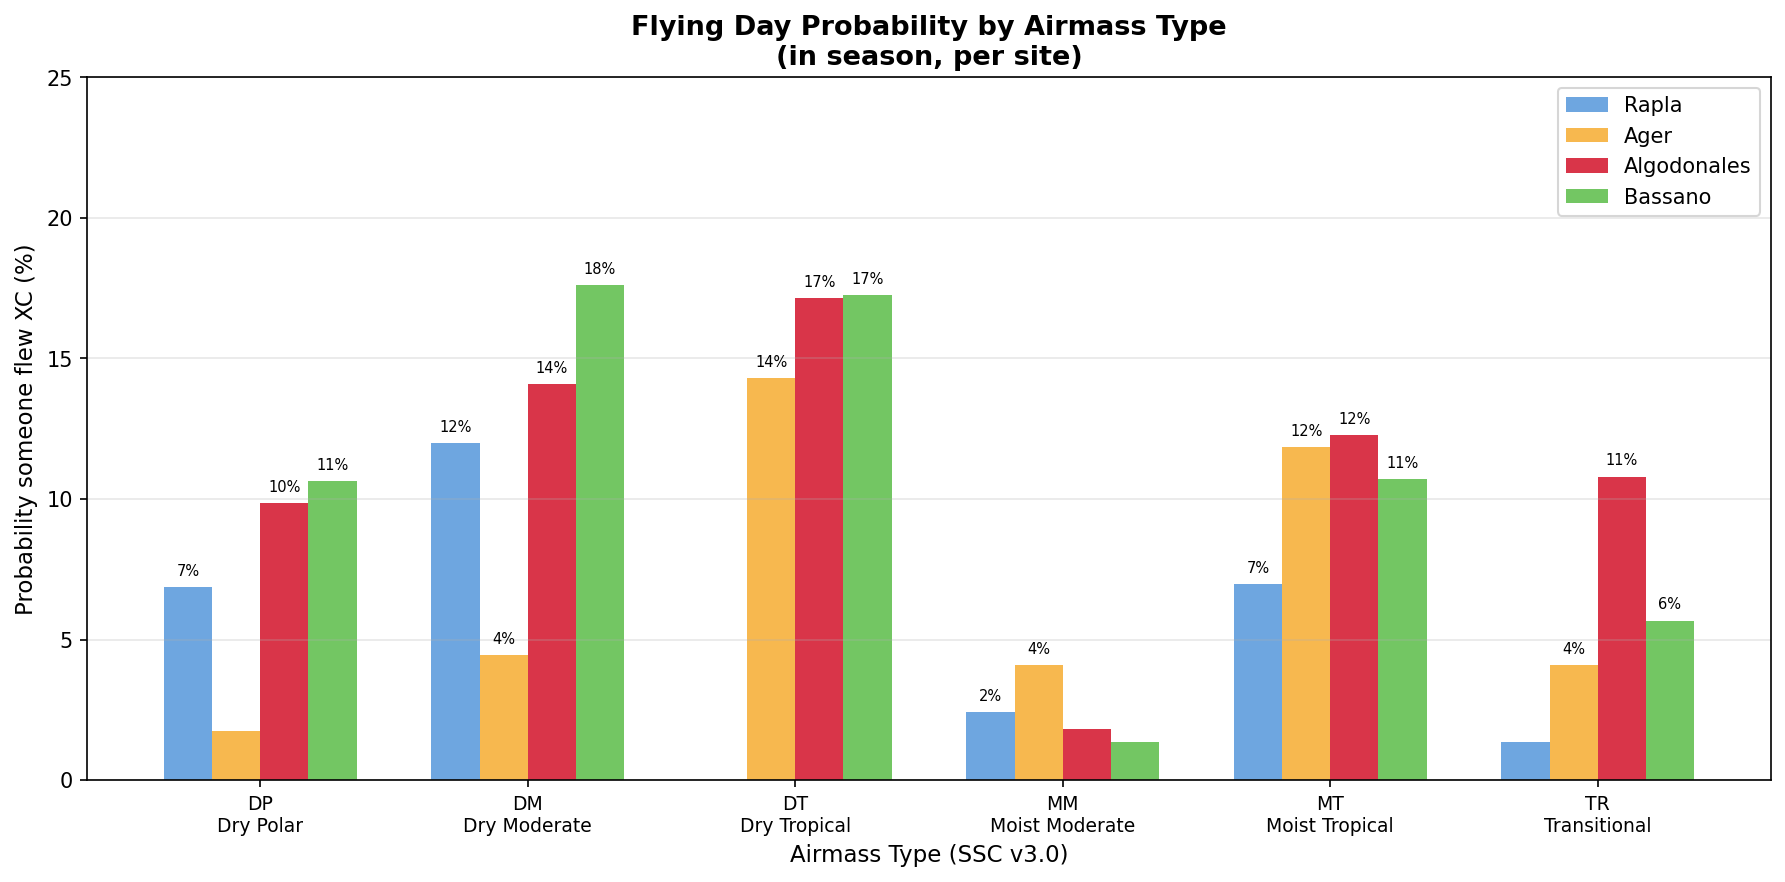
A more practical question: “If I see this airmass type in the forecast, what’s the probability that someone actually flies XC?”
The results reveal two distinct regimes:
Dry types drive flying. DM, DT, and DP have the highest flying probability at every site. At Bassano, a DT day has a 19% chance of producing an XC flight; DM is 18%. At Algodonales, DT leads at 17%.
Moist types suppress flying. MM drops to 0.5–4% flying probability. MP is effectively zero — not a single XC flight day at Bassano or Algodonales occurred under Moist Polar conditions.
Transitional days are a gamble. TR shows ~1–11% probability depending on the site. Post-frontal clearing can produce excellent conditions later in the day, but the timing is unpredictable.
Ager is the outlier. MT (Moist Tropical) shows 12% flying probability at Ager — nearly as good as DT. This reflects the Mediterranean summer pattern: warm, humid air with sea-breeze convergence along the Pyrenean foothills creates reliable thermals even under moist conditions. Ager’s 1,300 m launch altitude places pilots inside the convective layer, bypassing the surface-level moisture cap.
The Physical Mechanism: Why DP Wins
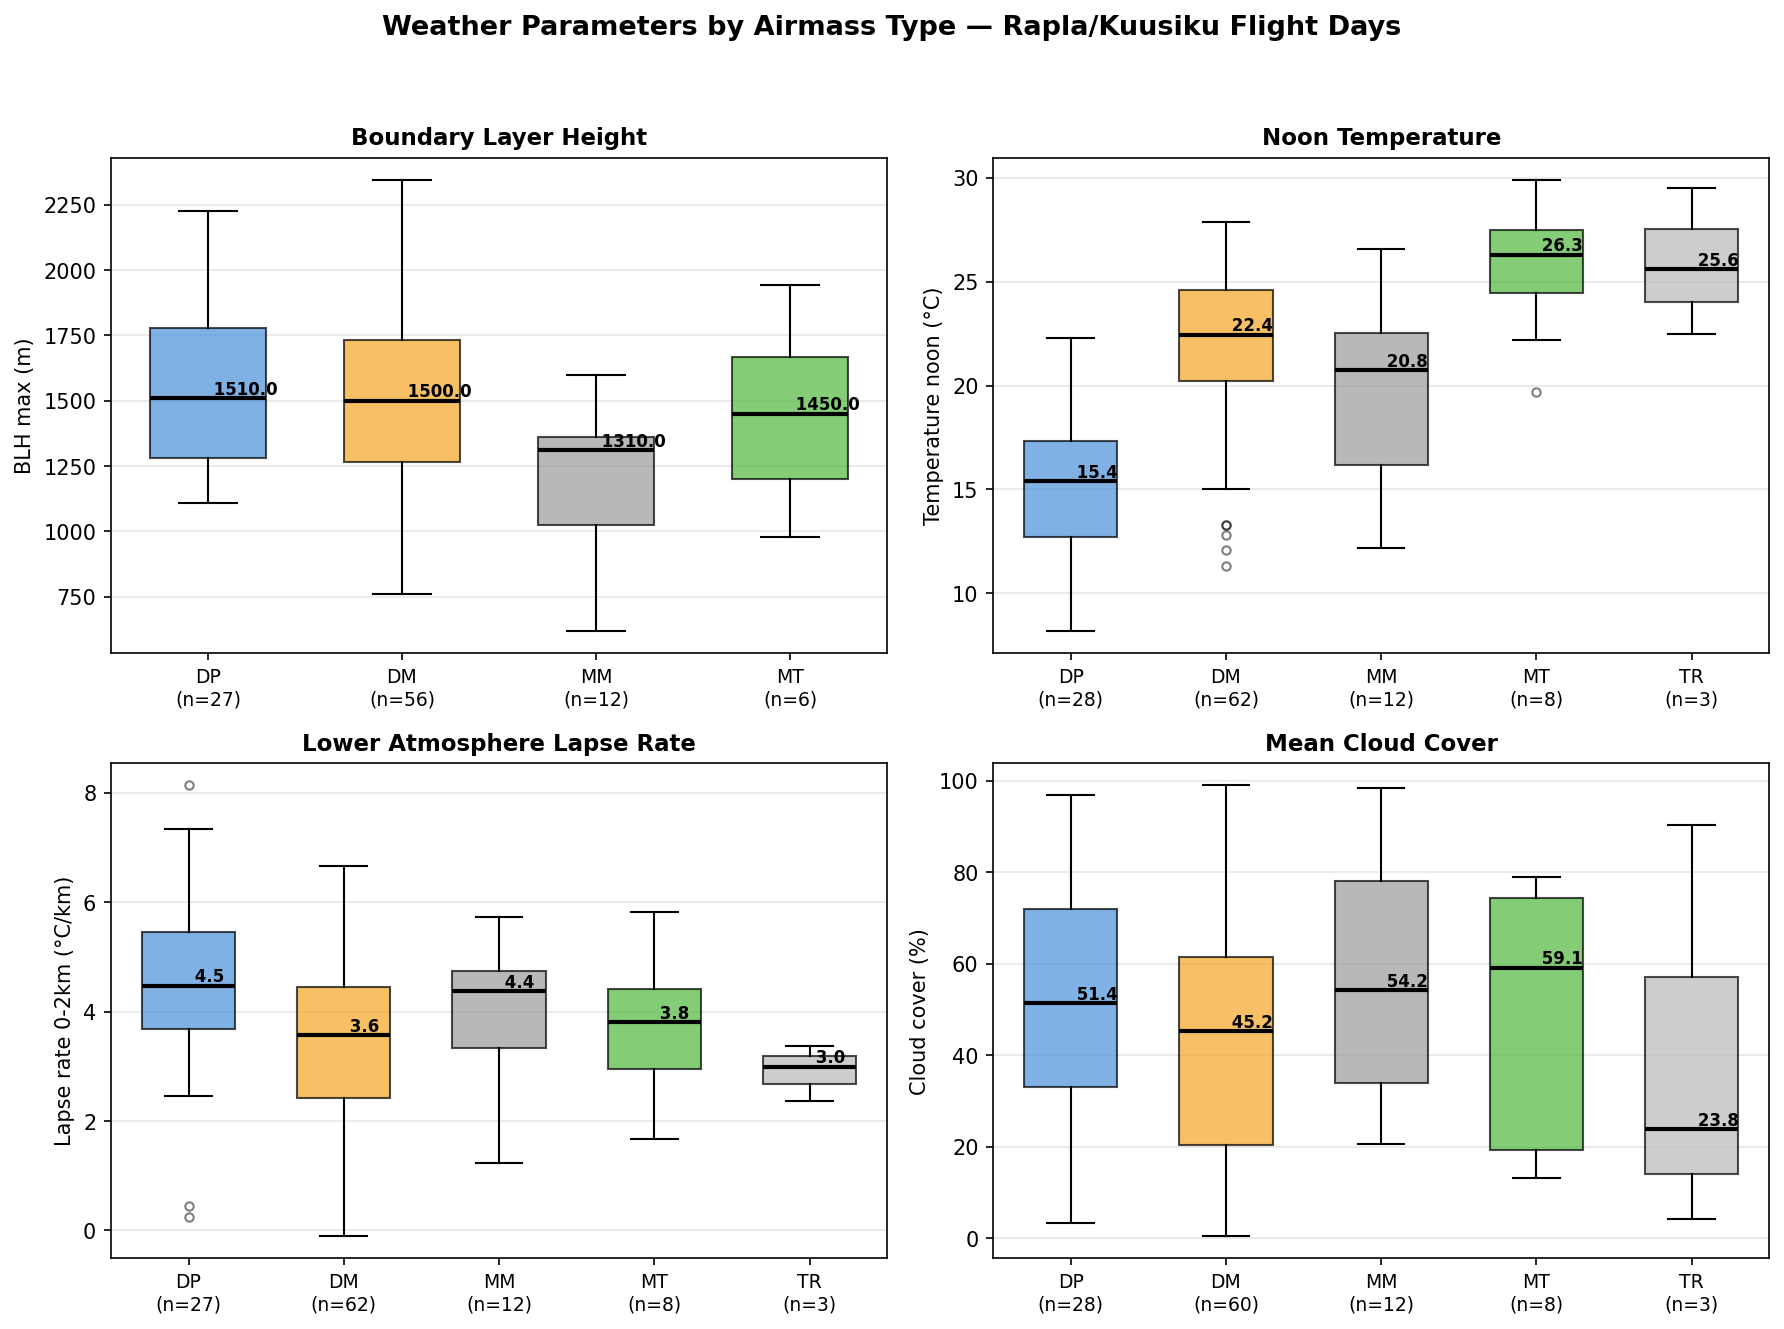
The Rapla dataset (the only one with full weather data for each flight day) reveals why DP outperforms on distance:
Higher lapse rates. DP days have a median 0-2 km lapse rate of 4.5 °C/km — significantly steeper than DM’s 3.6 °C/km. Steeper lapse rates mean stronger thermals with higher climb rates, enabling longer glides between thermals.
Equivalent boundary layer height. DP and DM have nearly identical median BLH (~1,500 m). The thermal ceiling isn’t higher for DP — the thermals are just stronger within the same envelope.
Cooler surface temperature. DP is a cold airmass (median 15.4 °C vs. DM’s 22.4 °C). The high lapse rate comes from cold air aloft, not surface heating. This is the classic post-frontal setup: a deep unstable layer where thermals punch through without needing extreme surface temperatures.
Variable cloud cover. DP and DM show similar median cloud cover (~45–51%), but DP has wider variance — some DP days are crystal-clear (the best ones), while others are overcast (these don’t produce flights). DM is more consistent but less extreme.
The Heatmap View: Patterns Across Sites
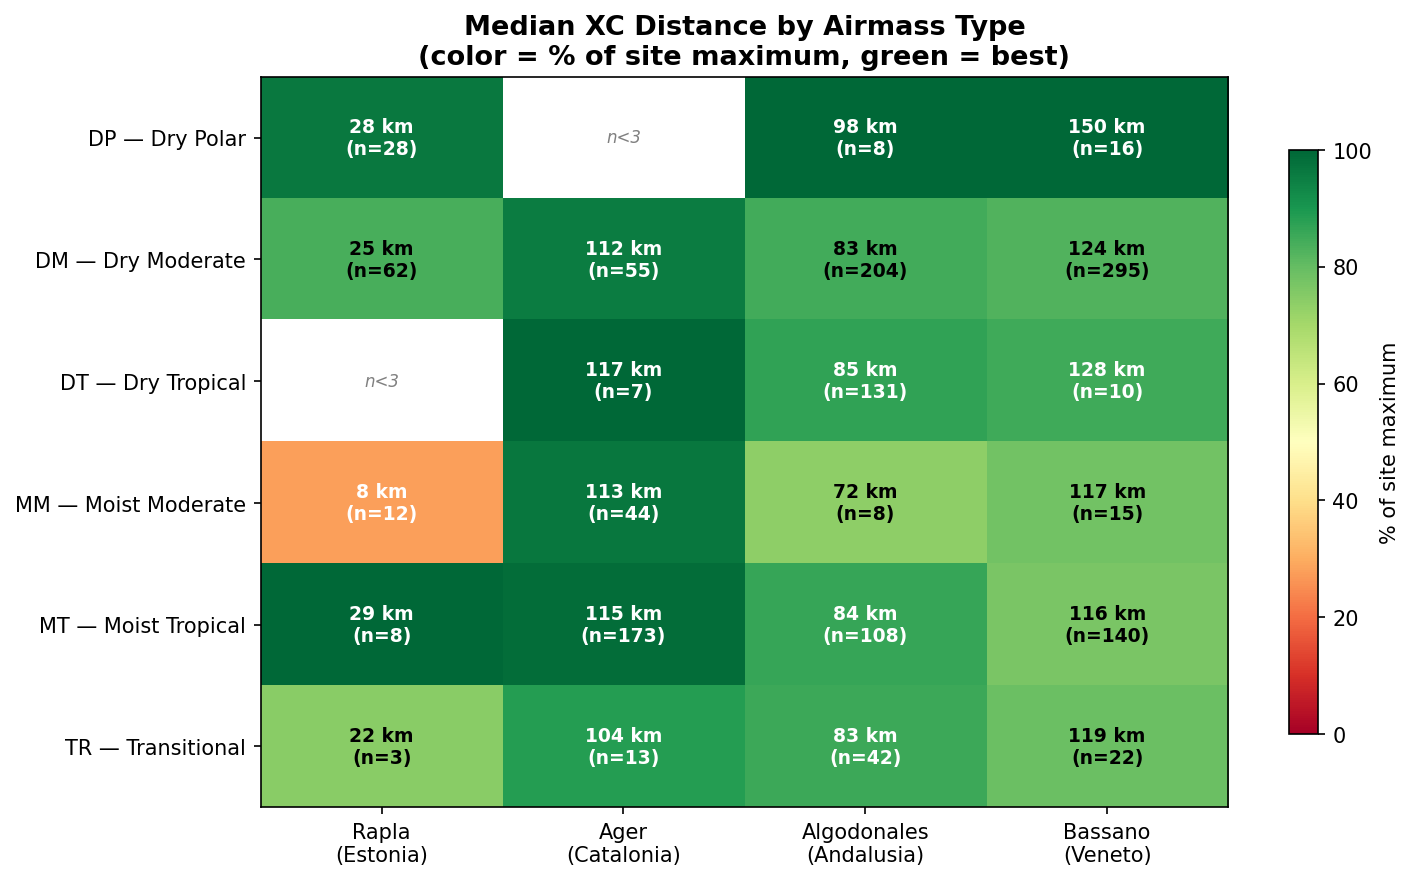
The heatmap normalizes each site to its own maximum, revealing which airmass types perform best relative to the site’s potential. Green cells are the best performers.
Key patterns:
- DP dominates at Bassano, Algodonales, and Rapla (darkest green)
- DM is always mid-tier — solid green but never the darkest
- MM is universally weak — orange at Rapla (only 8 km median!), lighter green elsewhere
- Ager is different — MM and MT perform nearly as well as DM, reflecting the mountain convergence dynamics that make Ager’s meteorology inverted relative to flatland
Practical Implications
For trip planning
If you’re booking a paragliding trip weeks in advance, you can’t predict the specific airmass. But you can choose seasons and locations that maximize DP/DT exposure:
- Bassano spring (March–April): frequent post-frontal DP days between Mediterranean lows
- Algodonales summer (June–August): DT dominant, with occasional DP after Atlantic troughs
- Rapla late spring (May): DP days after Scandinavian cold fronts
For daily go/no-go decisions
Check the airmass classification (available at sheridan.geog.kent.edu/ssc.html or via our daily briefing):
- DP or DT → go. These are statistically the best XC days.
- DM → go, but manage expectations. Good for flying, but epic distances are less likely (except on flatland where light winds matter more).
- MM or MP → stay home. Flying probability drops to near zero.
- TR → watch the clearing. If the front passes early, the afternoon could be excellent.
For forecasting algorithms — does airmass type improve predictions?
This was the natural next question: if DP days are demonstrably better, should I add airmass type as a feature in my XC forecast models? I asked Claude to run a redundancy analysis against the Rapla dataset (114 flight dates with full weather data + SSC classification), and the answer was sobering.
SSC type explains only 3.8% of flight distance variance (eta² = 0.038). Individual weather parameters that my assessors already use — BLH, temperature, wind, cloud cover, lapse rate, precipitation — collectively explain ~27% (sum of r²). SSC adds almost nothing on top.
The reason becomes clear when you check what SSC actually encodes:
| What SSC captures | How well (eta²) | Already in assessor? |
|---|---|---|
| Temperature | 0.429 (large) | Yes |
| Precipitation | 0.116 (medium) | Yes |
| BLH | 0.110 (medium) | Yes |
| Lapse rate | 0.099 (medium) | Yes |
| Wind speed | 0.036 (small) | Yes |
| Cloud cover | 0.033 (small) | Yes |
SSC is essentially a temperature proxy (eta² = 0.43!) with partial encoding of BLH and lapse rate — all parameters the assessors already use directly. After controlling for these individual parameters, the residual SSC signal is weak (eta² 0.01–0.12 within weather terciles).
There’s also a practical blocker: SSC is retrospective, not a forecast. SSC v3.0 classifies days based on observed data, typically with a 1–2 day lag. You can’t look up tomorrow’s airmass type. You could in principle classify NWP forecast output into SSC-like categories, but that’s just adding a classification layer on top of the same parameters you’re already feeding to the assessor — no new information enters the system.
Verdict: airmass type is a useful diagnostic and educational concept, but it does not improve algorithmic forecast accuracy when you already have the underlying weather parameters. The value of “think in terms of air masses” is for human pilots making quick decisions — “post-frontal clearing → probably a good day” — not for numerical prediction.
Limitations
- Selection bias in flight data. XContest captures only flights that pilots chose to log. DP days may also correlate with weekends or pilot availability.
- SSC station distance. The nearest SSC station is 50–170 km from the flying site. Local effects (valley winds, sea breezes) may differ from the synoptic classification.
- Rapla dataset includes all skill levels. Median distances at Rapla (8–29 km) reflect a mix of beginners and experts. Bassano and Ager data is pre-filtered for longer flights (≥100 km), producing higher medians.
- DP sample size at some sites is small. Ager has only 1 DP date (BCN SSC), Algodonales has 8. Bassano’s 16 DP dates and Rapla’s 28 provide more statistical power.
- No control for wind speed/direction. Airmass type correlates with wind patterns. The DP advantage may partially reflect optimal wind conditions rather than thermal quality alone.
- Redundancy analysis uses Rapla only. The conclusion that SSC is redundant with individual weather parameters is based on the 114 Rapla dates (the only site with full weather data per flight day). The pattern likely holds at other sites, but is not directly verified.
Conclusion
Across 5,160 flights at four European sites, the data validates the old-school synoptic intuition: Dry Polar (post-cold-front) air masses produce the longest cross-country flights. The mechanism is clear — steeper lapse rates create stronger thermals within the same boundary layer height.
But the data also reveals a nuance that the classic texts, focused on “ideal” conditions, didn’t emphasize: Dry Moderate air masses are the workhorse of XC flying. They produce nearly 2x more flying days than their seasonal frequency would predict, because their moderate instability and light winds create the widest flyable window. The best individual flights often happen on DM days — especially on flatland where wind is the limiting factor.
And there’s a twist for the algorithmically inclined: airmass type does not improve numerical prediction when you already have the underlying weather parameters (BLH, temperature, lapse rate, etc.). SSC is largely redundant with what modern forecast APIs provide. The value of thinking in air masses is for the human pilot’s mental model, not for the machine’s feature vector.
The practical takeaway: if the synoptic chart shows a cold front just passed and high pressure building — the old-timers would say “go fly.” The data agrees.
Data and Methods
- Flight data: XContest archives (xcontest.org), 2007–2025
- Airmass classification: SSC v3.0, Sheridan, Scott C., Kent State University. sheridan.geog.kent.edu/ssc.html
- Weather reanalysis: ERA5 (BLH), Open-Meteo (temperature, wind, cloud cover, lapse rate)
- Analysis code:
airmass_analysis.py,airmass_charts.py,airmass_redundancy.py - This article: source markdown
- Flying day probability computed over the season (Apr–Sep for Estonia, Mar–Oct for southern sites) within each site’s XContest date range
- Redundancy analysis: eta-squared (ANOVA effect size) and within-tercile residual SSC signal
References
[1] Sheridan, Scott C. “The Redevelopment of a Weather-Type Classification Scheme for North America.” International Journal of Climatology, 22(1), 51–68, 2002.
[2] Sheridan, Scott C. “Spatial Synoptic Classification v3.0.” Kent State University. https://sheridan.geog.kent.edu/ssc.html
[3] Wallington, C.E. “Meteorology for Glider Pilots.” John Murray, London, 1961. Classic treatment of air mass types and their effect on soaring conditions.
[4] Zverev, A.S. “Synoptic Meteorology” (Синоптическая метеорология). Gidrometeoizdat, Leningrad, 1977. General synoptic meteorology textbook with air mass classification theory.