AI disclaimer. I selected the stations to study, collected the IMEREM1 data, and provided the background aerial imagery. Everything else here — the analysis, the figures, and the text of this post — was done by Claude Code.
The problem
There are three ridge soaring sites within easy reach of Tallinn: Paldiski, Türisalu and Tabasalu. Each is a coastal cliff, and each only works in a narrow band of wind direction — Türisalu’s optimal window is 312°–342°. Whether the day is flyable is mostly a question of what the wind is doing at the cliff, right now.
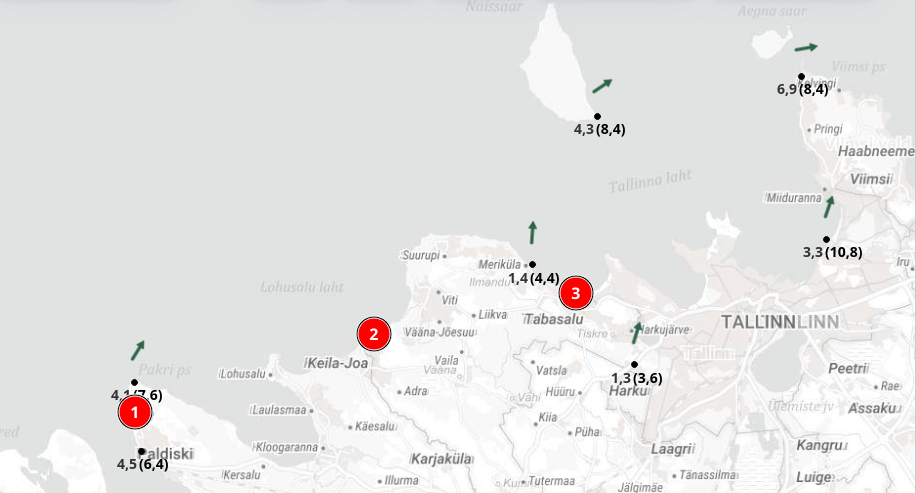
The official station coverage is uneven. Distances from each launch to the stations currently used for it:
| Site | Nearest stations |
|---|---|
| Paldiski | Pakri 1.2 km, Paldiski Põhjasadam 3.3 km |
| Tabasalu | Tilgu 3.4 km, Tallinn-Harku 5.8 km |
| Türisalu | Tilgu 10.1 km, Tallinn-Harku 16.0 km, Pakri 16.4 km, Naissaare 19.0 km |
Paldiski and Tabasalu have a station close enough to trust. Türisalu has nothing within 10 km, and none of the four distant stations has a useful line of sight to the same piece of coast. Pakri, in particular, reads 27–30° more southerly than Põhjasadam, in the exact WSW–NW sector that matters for Türisalu.
Weather Underground PWS
Weather Underground runs a network of privately owned weather stations. Anyone with a consumer weather station — typically an Ecowitt or Fine Offset unit, costing a few hundred euros — can register it; after that, it uploads its readings, which become publicly visible. The stations are not sited, calibrated or maintained to any standard. They sit in gardens, behind hedges, on house walls. Cadence is usually around 5 minutes, which is better than most official Estonian stations, and many of them report gusts and wind direction in degrees.
The data is served imperial by default (mph, °F, inHg), and each observation carries a quality-control flag from Weather Underground’s own checks.
The question was whether one of these garden stations could fill the gap at Türisalu.
The station: IMEREM1, Meremõisa
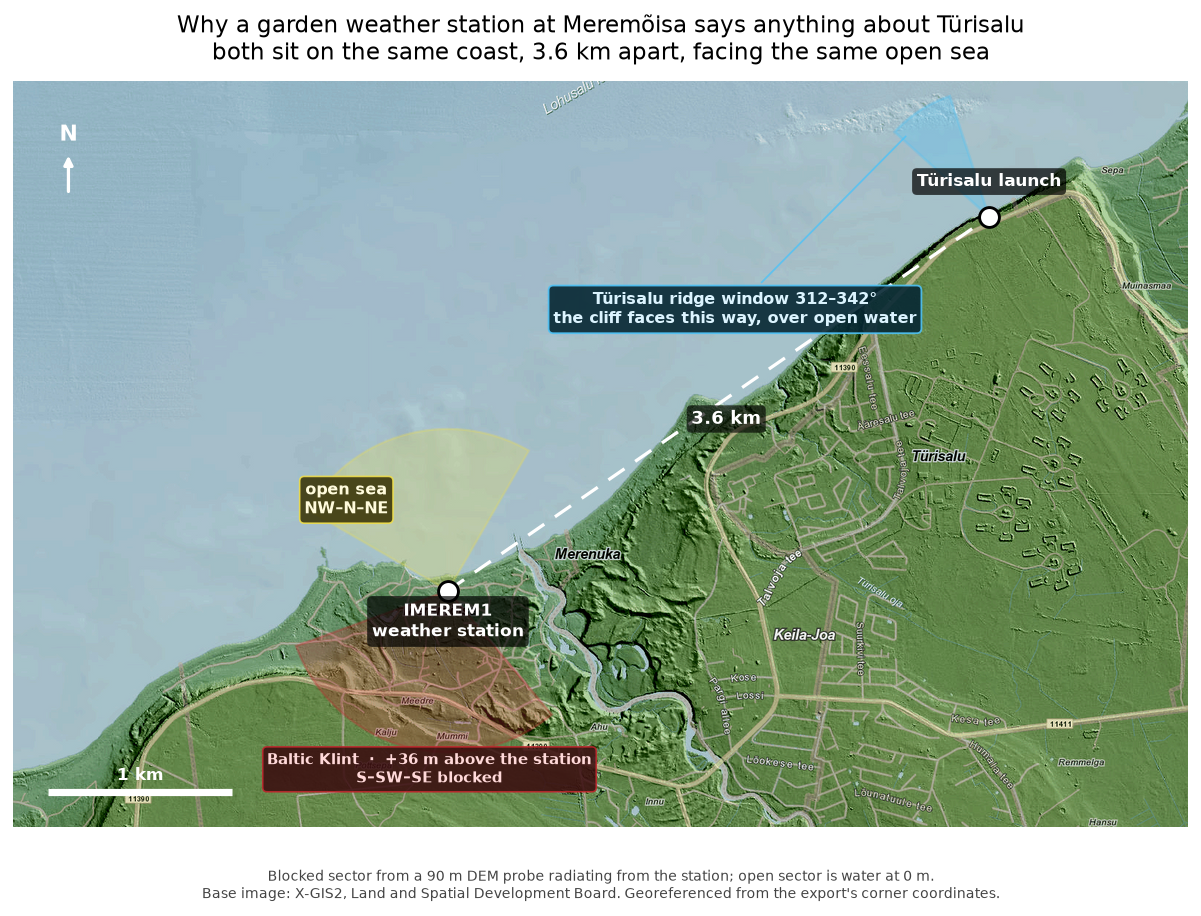
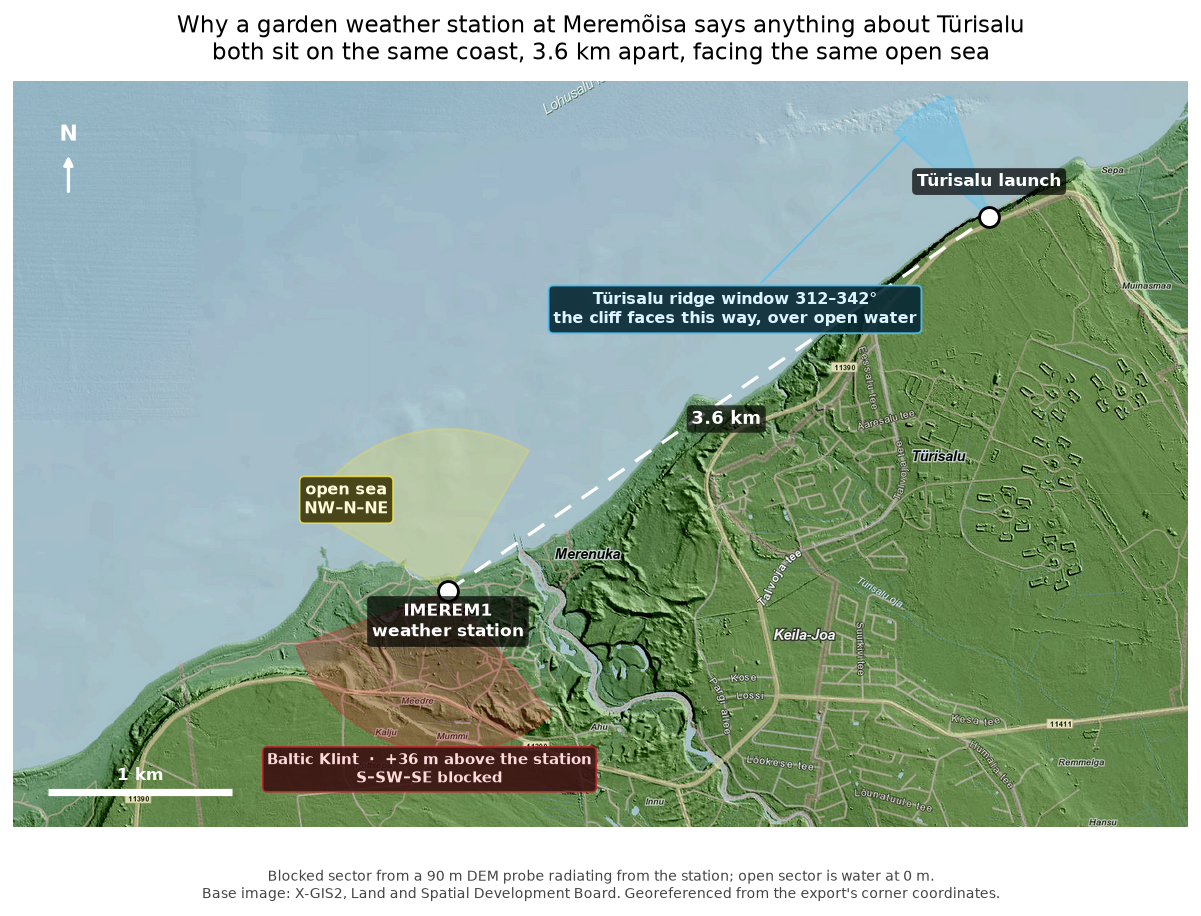
One PWS sits near Türisalu: IMEREM1 “Merela”, at 59.4027 N, 24.2718 E in Meremõisa. It is a Fine Offset/Ecowitt unit that reports every ~5 minutes and measures wind speed, gust, direction, temperature, dew point, pressure, humidity, precipitation, and solar radiation.
It is 3.4 km from the Türisalu launch — roughly three times closer than anything currently used — on the same stretch of coast, facing the same open sea.
What was measured
IMEREM1’s hourly readings were compared against Paldiski Põhjasadam, with a 3 m/s floor on the reference wind. That gives 612 usable hours, 162 of them in the NW sector.
Põhjasadam was used as the reference rather than the closer Pakri because Pakri’s directional bias falls within the Türisalu window and would have been laundered into the result.
Direction works
In the Türisalu window, the median direction offset is 0°. Typical error is about 9°, once a 1.5 m/s floor is applied to IMEREM1’s own wind — below that, the anemometer stalls and the vane wanders.
| Reference bearing | Mean absolute direction error |
|---|---|
| 300–315° | 10.1° |
| 315–330° | 9.4° |
| 330–345° | 8.1° |
| Türisalu optimal 312–342° | 8.6° (n = 79 h) |
The scatter shrinks as the station gets more fetch, while the median stays put, which is what a vane that genuinely tracks looks like. Outside the NW sector, the errors run 17–33°, but those directions are not flyable at Türisalu anyway.
There are other private stations near Türisalu, but they are farther from the coastline.
Speed does not, at least not with a single correction factor
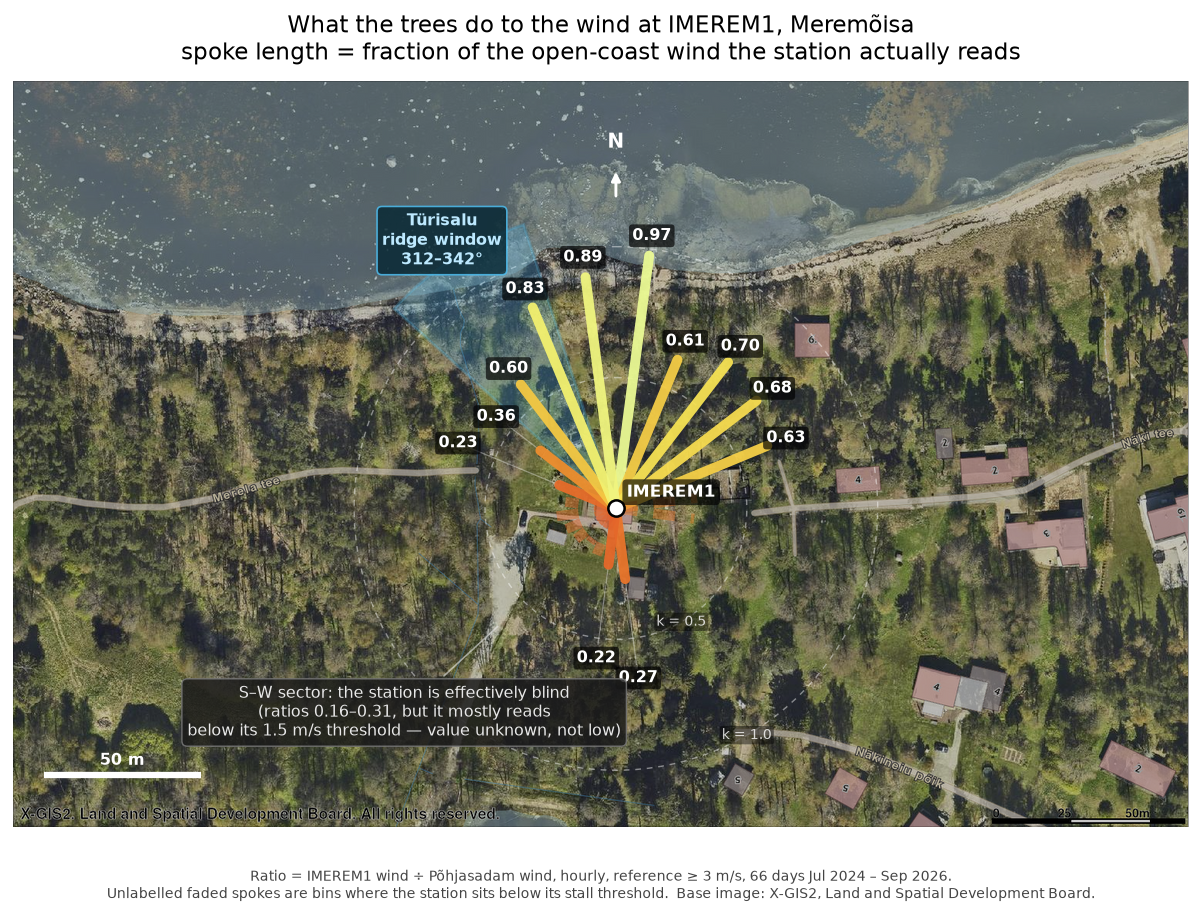
The ratio of IMEREM1’s wind to the reference wind depends strongly on which way the wind is coming from.
| Reference bearing | Wind ratio | Gust ratio |
|---|---|---|
| 285–300° | 0.22 | 0.28 |
| 300–315° | 0.40 | 0.43 |
| 315–330° | 0.61 | 0.54 |
| 330–345° | 0.86 | 0.68 |
| 345–360° | 0.87 | 0.69 |
| 0–15° | 0.97 | 0.64 |
The Türisalu optimal window straddles the steepest part of that curve: 0.61 at 320° rising to 0.86 at 335°. A single scalar correction across the window hides a factor of 1.4. The 0.97 at 0–15° is unexplained — either Põhjasadam is itself sheltered from due north, or there is local acceleration at the mouth of the clearing.
Two obstructions, not one
A 90 m elevation model, probed radially from the station, separates terrain from vegetation because it cannot see trees at all. Where it shows flat ground but the ratio is low, the obstruction has to be local.
- 150–240° (S/SW/SE): terrain. The Baltic Klint, +36 m above the station within 1–1.5 km. Permanent.
- 270–315° (W/WNW): trees. The elevation model shows water or flat ground, yet the ratio ranges from 0.23 to 0.36. That is the tree band visible in the aerial photo.
- 330–030° (N/NNW): nothing. Open sea, ratio 0.83–0.97.
The aerial imagery was looked at only after the numbers were computed; nothing was tuned to fit it.
This matters because the Türisalu window falls within the tree-controlled sector, not the terrain one, where a seasonal effect could still hide.
Winter
Nine bare-season strong-wind days from Nov 2024 – Feb 2026, reconstructed using long-record Pakri data, give a ratio of 0.89 in the ridge window — essentially 1:1 between 5 and 9 m/s. The station is not sheltered in winter; it simply cannot resolve light winter wind.
These winter numbers are Pakri-referenced while the bearing curve above is Põhjasadam-referenced, so the two are not directly comparable. What transfers is the conclusion about stall, not the value.
Gusts remain the weakness
Even on the days where the mean wind tracks 1:1, gusts come in at 0.56 — the station under-reads them by nearly half. Gusts are the ridge go/no-go quantity.
Check against recorded flights
XContest holds 78 Türisalu flights on 46 days, 2016–2025. IMEREM1’s record starts in 2024, so ten of them have station data.
Seven of ten had IMEREM1’s raw, uncorrected bearing inside the documented 312–342° window; eight of ten inside the wider acceptable window. Wind at the station ran 2.0–6.7 m/s (median 4.4), gusts 2.6–8.2 m/s.
Applying the shelter curve, a median 4.4 m/s at IMEREM1 implies roughly 5–7 m/s free-air, which is an unremarkable Türisalu soaring wind. The curve and the flight record agree without either having been fitted to the other.
This is not a gate. It is positive-only — no XContest entry means nobody logged a flight, not that conditions were unflyable — and n = 10.
A caution about the reference station
The ratio appeared to have a strong daily cycle, with a minimum at midday, which is the opposite of what convective mixing predicts. Against Pakri, over a comparable sample, it disappears completely.
The daily cycle belongs to Põhjasadam, not to IMEREM1. Põhjasadam gains wind through the middle of the day that neither IMEREM1 nor Pakri shares — a sea breeze in Paldiski bay is the obvious candidate, though that is inference, not measurement. Põhjasadam is used elsewhere as a Paldiski wind truth, so this is worth carrying forward beyond this study.
Where this leaves it
A chart line and a direction source, not a gate. The direction reading is usable today and fills a gap that nothing else fills. The magnitude will not be known until the bearing-dependent correction firms up.
Still open:
- The sample above 10 m/s is thin, and that is the regime where a wrong correction is dangerous.
- Genuine leaf-off calibration will need to be collected from November 2026 onward — the reference archive does not extend far enough to reconstruct it. Two-thirds of Türisalu flying happens with bare trees, so the calibration gap and the flying season are the same gap.
- Whether the correction is applied per-bearing or the station is used for direction only. The second is defensible today; the first is not.
- Nothing is deployed. This is research.
Forecasts and observations for the Estonian sites are at meteo.matrunich.com.