This post was written with the help of Claude Code (Anthropic). Claude built the analysis pipeline, generated the visualizations, and helped draft the article.
At the end of July 2025, I flew in the Aukštaitijos Taurė 2025 paragliding competition in Panevėžys, Lithuania. Two days, around 40 pilots, winch launching from a flat field. I was competing in the EN-B (Standard) class on my UP Kibo X.
I don’t have much thermalling experience — most of my flying is ridge soaring at coastal sites in Estonia, where thermals are rare and weak. That’s actually why I’m building meteo.matrunich.com, a personal weather system to catch any flyable day in Estonia and maximize my airtime.
During one of the thermals on July 27, I was circling together with several other pilots. Even in the air, I could feel it: they were climbing faster than me. Same thermal, same air, same altitude band — but they kept gaining while I was hovering or sinking. The experience stuck with me.
Months later, I decided to quantify exactly what happened. Claude Code made it realistic — building a co-location finder, orbit detector, and thermal scoring system from IGC tracklogs is the kind of task that would take weeks to code manually, but took hours with AI pair programming. I downloaded the competition IGC files, and Claude wrote the analysis pipeline: match pilots by GPS position and time, detect individual orbits from heading changes, compute per-orbit metrics, strip winch tow phases, and score thermal technique. The results are both humbling and actionable.
The setup
The thermal lasted about 20 minutes (12:02–12:23 UTC). Claude’s co-location tool scanned competition IGC files and matched pilots who were within 200m horizontally and 150m vertically of my position. Four pilots matched:
| Pilot | Co-located time | Avg distance | Competition result |
|---|---|---|---|
| Robertas Jasiūnas | 609s (~10 min) | 95m | 7th overall |
| Andrej Kovaliov | 361s (~6 min) | 94m | 5th overall |
| Darius Lukosevičius | 264s (~4 min) | 117m | 1st overall |
| Oleg Avgustinas | 197s (~3 min) | 110m | 9th overall |
For reference, I finished 18th out of 21 pilots.
So I was thermalling alongside the competition winner without knowing it. That explains the feeling.
Finding #1: I circle too slowly
This is the headline. My average stabilized orbit time was 41 seconds. Robertas circled in 28 seconds. Darius — the overall winner — in 24 seconds. The textbook optimum is 16 seconds.
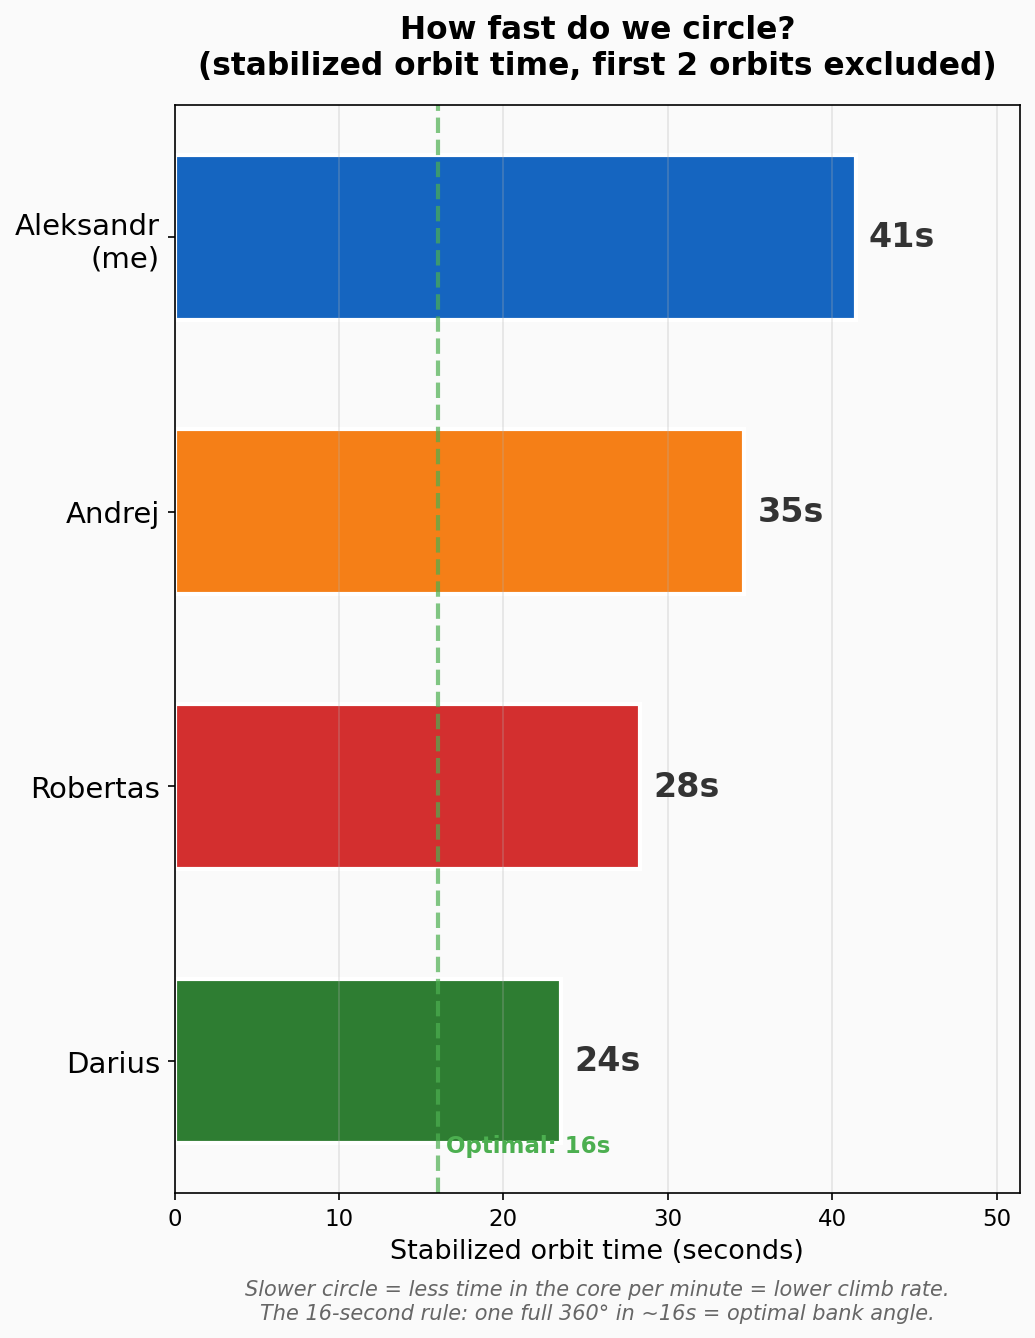
What does orbit time mean in practice? A slower circle has a larger radius, which means I spend more time on the outer edge of the thermal where lift is weak or absent, and less time in the narrow core where the air rises fastest. Over 20 minutes, the difference compounds:
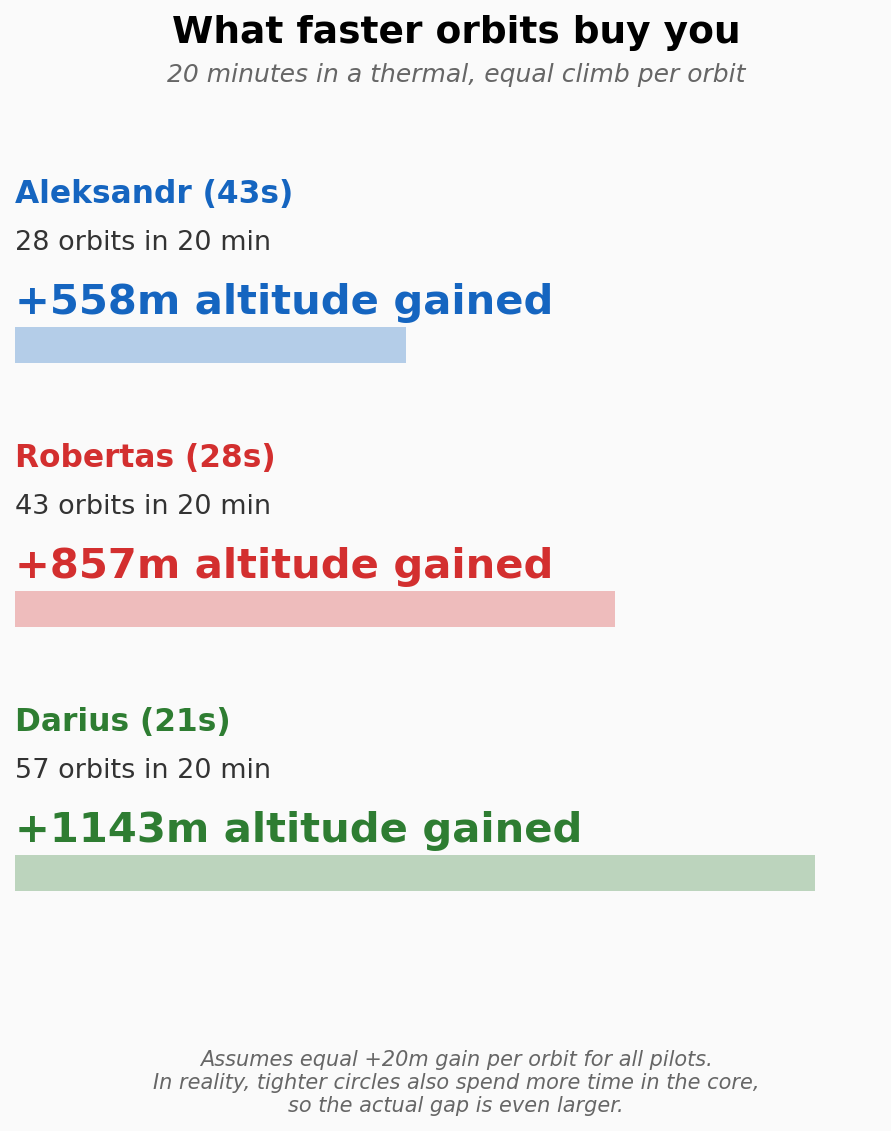
At 43 seconds per orbit, I complete about 28 circles in 20 minutes. At Darius’s 21 seconds, he fits 57 — more than double. Even if we assume the same +20m gain per orbit (conservative), that’s 560m vs 1140m of altitude. The real gap is even larger because tighter circles also position the pilot in stronger lift.
Why was I circling so slowly? Not because steep banking feels uncomfortable — I was afraid to lose altitude by committing to a steep turn in the wrong place. Without knowing where the core is, banking hard feels like a gamble: if I’m not in the right spot, a tight circle just burns altitude faster. So I flew flat, wide circles, hoping to stumble into the core. The irony is that wide circles guarantee I spend most of my time outside the core.
Finding #2: I lose the thermal and don’t recover quickly
Looking at the per-orbit climb rate, the pattern is clear: I had several orbits of sustained sink while supposedly “in” the thermal.
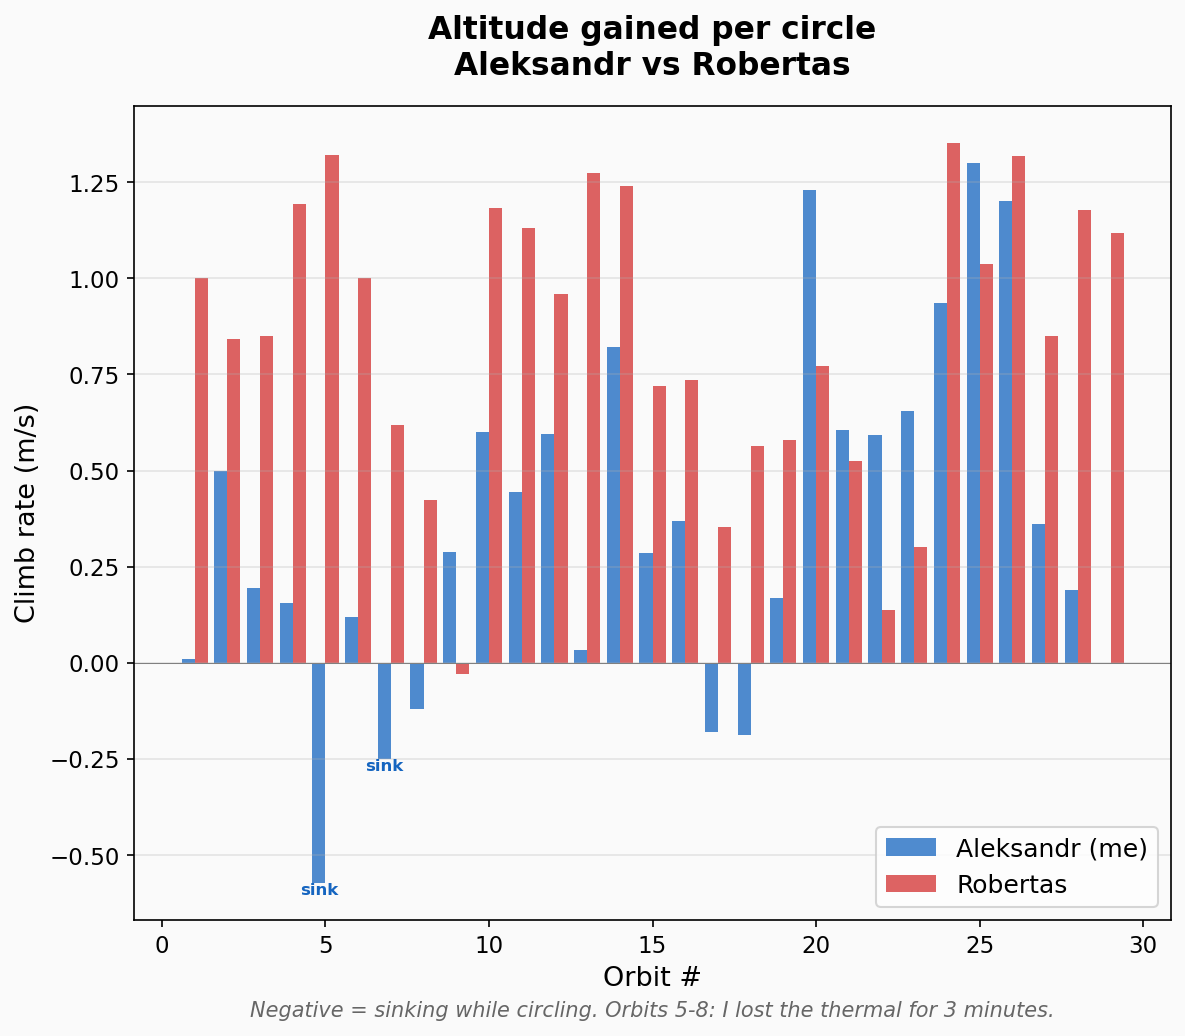
Orbits 5–8 stand out: -24m, -8m, -11m in up to 92 seconds — I lost the core and kept circling in dead air for over 3 minutes. Robertas had one bad stretch (orbit #11, -59m) but immediately recovered with +22m on the next orbit.
This is the centering skill that competition pilot Dmitry Kalita describes: top pilots position themselves ±5m closer to the core on every circle. It’s invisible to the naked eye, but it compounds. Their recovery from a bad orbit is almost instant because they can feel the asymmetry in the lift and correct within a quarter-turn. I kept circling through sink hoping the core would come back on its own.
Finding #3: The altitude profiles tell the whole story
Here is Robertas and me, in the same thermal, over the same 20 minutes:
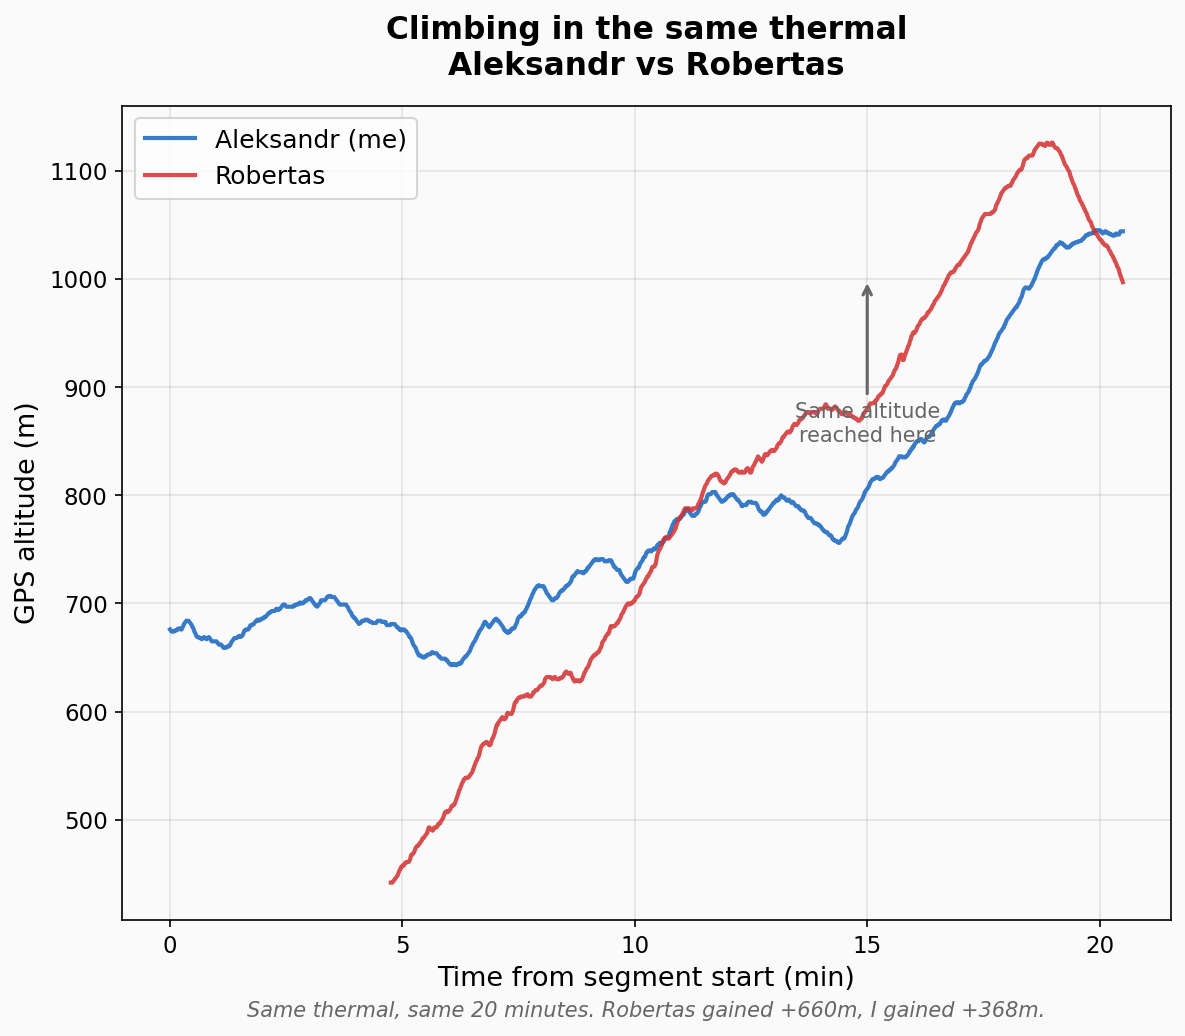
Robertas entered 340 meters below me (337m vs 676m) and ended just 47 meters lower (997m vs 1044m). He gained +660m, I gained +368m. In the same air.
The chart shows the divergence accumulating steadily—not from a single dramatic moment, but from every orbit being slightly more efficient. This is what Kalita means when he says centering is the primary skill differential: a few extra meters per circle, invisible in real time, devastating over 20 minutes.
The numbers
For those who want the raw data, here’s the comparison table from the analysis tool:
| Metric | Aleksandr | Robertas | Darius* |
|---|---|---|---|
| Alt gain | +368m | +660m | +81m* |
| Avg vspeed | 0.30 m/s | 0.53 m/s | 0.11 m/s* |
| Stabilized orbit time | 41s | 28s | 24s |
| Orbit radius | 65m | 47m | 37m |
| Centering quality | 35% | 42% | 29%* |
| Netto vario | 1.40 m/s | 1.63 m/s | 1.21 m/s* |
| Thermal Score | 36/100 | 38/100 | 27/100* |
Darius’s overall metrics are skewed because he entered the thermal late after a winch tow release at 927m, then spent 5 minutes sinking before centering. His stabilized orbit quality (24s, 37m radius, +1.3 m/s per orbit) is the best in the group.
Netto vario is the estimated vertical speed of the air mass itself (GPS vspeed + wing’s sink rate of 1.1 m/s). When netto is higher, it means the pilot is flying through stronger lift — i.e., closer to the core center.
Centering quality is the fraction of time spent in above-median lift. 35% means I was in the strong part of the core about a third of the time; Robertas managed 42%.
Thermal Score is a composite 0–100 metric adapted from we-fly.cloud: 30% climb rate, 20% efficiency, 20% centering quality, 15% consistency, 15% sustained duration. Both of us scored “fair” (25–49 range). This thermal was wide and soft — nobody scored “excellent.”
What I’m working on
Core centering is my primary weakness. The data confirms it — my orbit time, my centering quality, and my recovery speed all point to the same root cause: I don’t know where the core is while I’m circling.
Three things I’m focusing on for next season:
- Reading the thermal in real time. The 45-degree rule says the vario peak lags the actual core position by about 45° of rotation. So when I hear the strongest beep, the core is already behind me — I need to wait another 1–2 seconds (about an eighth of a turn) before shifting my circle toward it. Right now I’m either reacting too late or not reacting at all.
- Active re-centering on every orbit. When vario drops during a circle, react within a quarter-turn: flatten the inside wing toward the stronger side. I currently keep circling passively and hope the core comes back. Robertas’s data shows he re-centers within a single orbit — one bad circle, then immediately back in the core.
- Committing to direction. My data shows 7 clockwise orbits mixed with 21 counter-clockwise in this thermal (Robertas: 0 CW, 40 CCW). Mixed turn direction means I was indecisive — switching directions, losing the rhythm, widening the circle. Pick a direction and stick with it.
The bank angle problem will solve itself once I can feel the core. When you know you’re in the right spot, committing to a steep turn is easy. When you don’t, banking hard just feels like burning altitude faster.
How the analysis was built
The analysis pipeline was built with Claude Code as an AI pair programmer, in Python on top of IGC file parsing:
- Co-location finder — parses all competition IGC files, matches pilots by GPS position and altitude within a time window
- Orbit detection — tracks cumulative heading change to identify individual 360° circles, computes radius, duration, drift
- Tow detection — strips winch tow phase from the analysis (straight-line flight + consistent climb = tow, not thermal)
- Thermal metrics — netto vario, centering quality, drift ratio, thermal score per we-fly.cloud formula
The source code is on my GitLab. If you have your own IGC files from a competition, you can run the same analysis on your flights.
—
Competition: Aukštaitijos Taurė 2025, Panevėžys, Lithuania, July 26–27, 2025. Task 1, July 27. Analysis based on publicly available IGC tracklogs.